
Mapping the tech world using text mining methods
Executive summary
This study presents an innovative methodology for analysing technology news using various text mining methods. News articles provide a rich source of information to track promising emerging technologies, relevant social challenges or policy issues. Our goal is to support the Next Generation Internet initiative by providing data science tools to map and analyse the developments of the tech word. Based on more than 200 000 articles from major media outlets, we are going to:
- Identify widely discussed topics, focusing on emerging technologies and policy issues,
- Dive deeper in selected areas and highlight key focal points of recent developments.
To meet these goals, a number of machine learning techniques are combined. The major steps can be summarised as follows:
- 17 general umbrella topics are explored
- 5 topics are selected for further analysis
- Deep dives are presented with 2D interactive maps
The topics selected for the deep dives are:
- AI and Robots
- Policy (sums up 3 relevant areas)
- Media
- Business
- Cybersecurity
The Policy topic groups together 3 areas: Social media crisis, Privacy and 5G.
Wide areas selected for deep-dive analyses

The 17 umbrella topics are identified using the topic modelling technique Latent Dirichlet Allocation. Besides the topics selected for deep dives, such areas are highlighted as Smartphones, CPU and other hardware, Digital ecosystems or Space.
Next, various maps are created based on the t-SNE algorithm. The example below presents the news stories in two-dimensions: articles that report on the same subject are clustered together. We demonstrate that this technique is highly useful to discover more narrow, domain-specific areas within the umbrella topics. Moreover, the distance between clusters is also meaningful, enabling the analysis of relationships between topics as well.
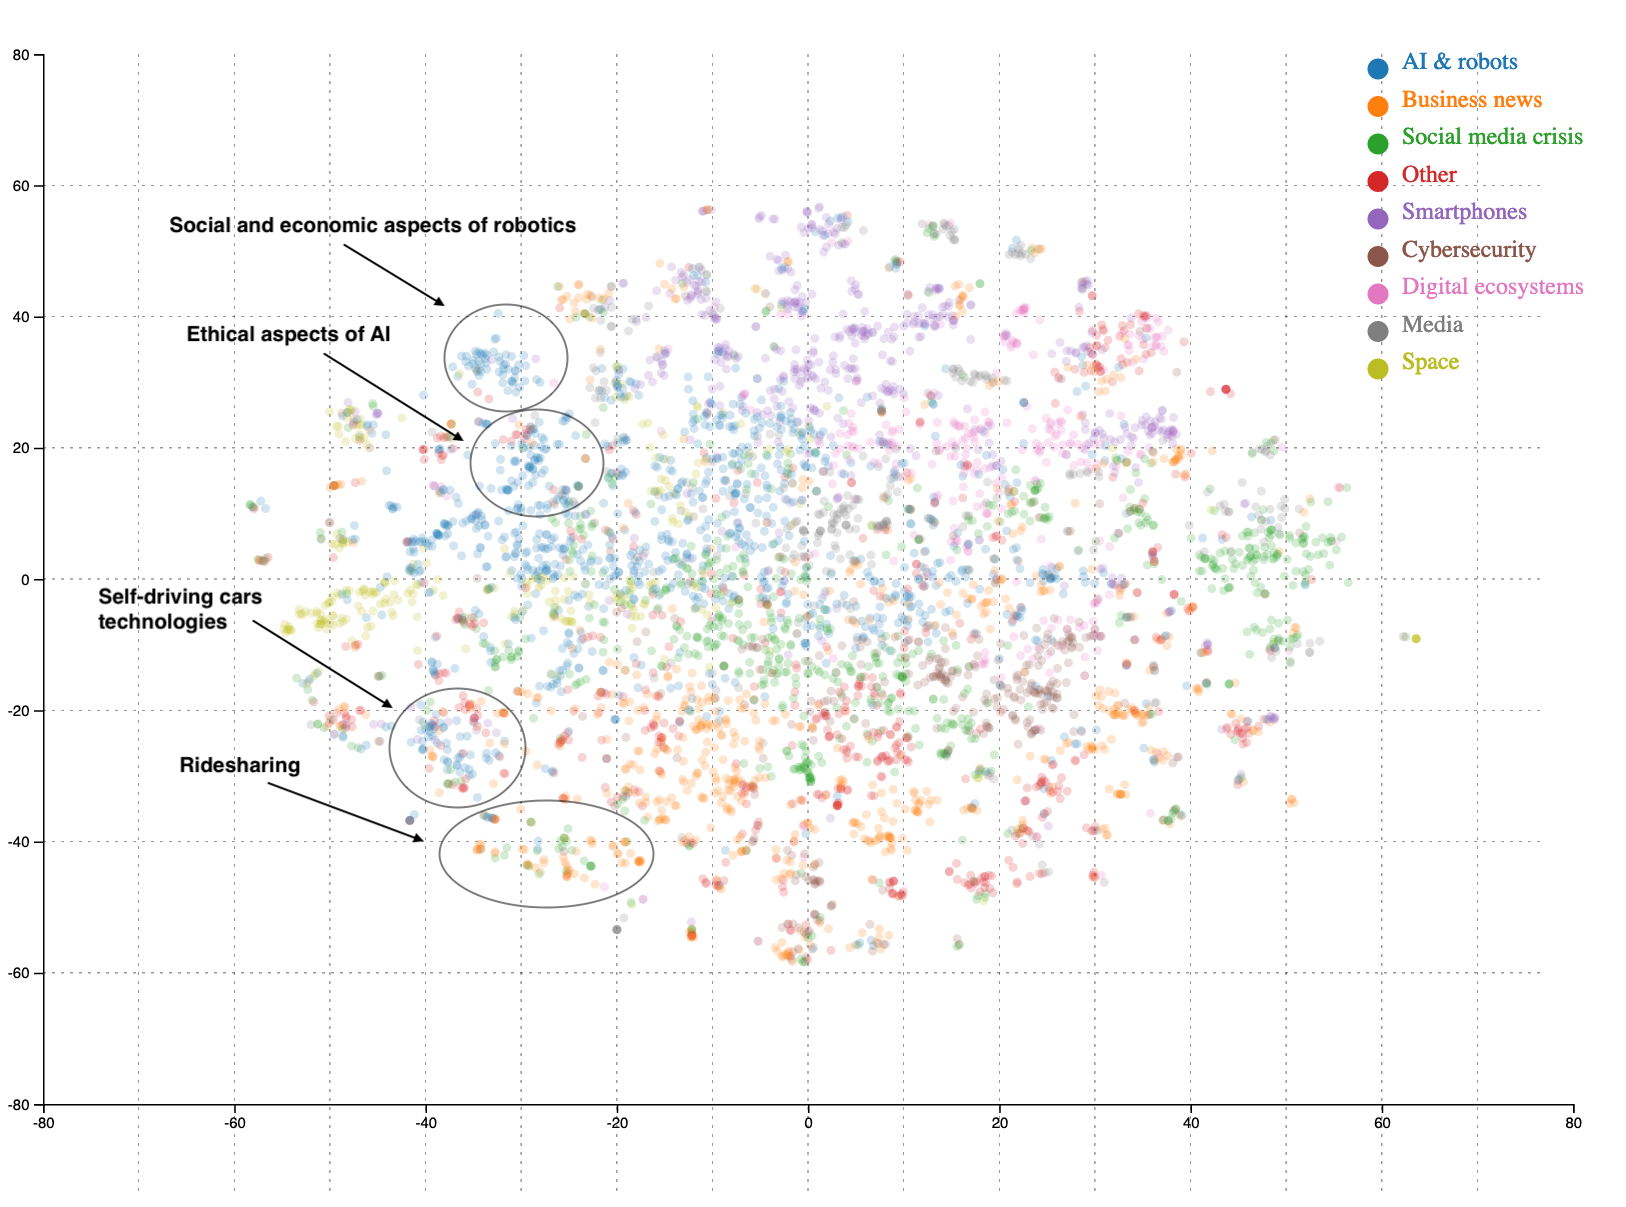
As an example, within the AI and robots topic, the map reveals groups of articles focused on such issues as:
- social and economic challenges of robotic technologies (e.g. job automation)
- ethical aspects of AI (e.g. military AI)
- AI advancements in the field of self-driving cars.
It is also visible that articles on social and ethical issues are closer to each other, while articles on AI in self-driving cars are placed near business news on ride-sharing apps. It shows that our methodology is efficient in decreasing the complexity of text data, enabling to analyse and map topics.
All maps are interactive, inviting users to explore the headline of articles. Click here for an interactive version.
Example articles
Social and economic aspects of robotics
- Robots do destroy jobs and lower wages
- Zume’s robot pizzeria could be the future of workplace automation
- RoboCop is real and could be patrolling a mall near you
Ethical aspects of AI
- Rise of the racist robots - how AI is learning all our worst impulses
- You should find out what’s going on in that neural network. Y’know they’re cheating now?
- Can you tell the difference between a real face and an AI-generated fake?
Self-driving cars technologies
- Where’s the lane? Self-driving cars confused by shabby U.S. roadways
- Jaguar’s new concept has a steering wheel you talk to and take with you
- Owl camera watches over your ride from the inside
The presented methodology provides intuitive, easily understandable results. To enhance the exploration of results, the study is presented as an interactive guide. This report has been designed with different readers in mind, offering various journeys. To analyse and understand the results, it is sufficient to read the introduction and results sections. We also prepared a guide briefly explaining various text-mining methods for anyone interested. Finally, detailed description of methods are included for proper reproducibility of the study in the methods section.
Introduction
News media provides wide coverage of breakthroughs and challenges related to technologies. This means that the information on technological developments throughout the years is freely available online. We created a set of innovative tools and measures to compile the information scattered online and to discover the patterns hidden beneath.
The data set consists of 213 000 tech media articles published by 14 major English-language online publishers (e.g. the Guardian, the Verge and Ars Technica). The data has been collected for a period of 40 months (between 2016-01-01 and 2019-04-30), and contains article metadata (name of the author, publication date etc.) and plain text. The data sets prepared during the project are available with documentation in a Zenodo repository.
In our previous works, we focused on dynamic changes to explore trends (see: Gyódi, Nawaro, Paliński and Wilamowski, 2019). Based on the evolution of term frequencies over time, we offered an overview of the most trending technologies and social issues. To further examine trending topics, we implemented various methods, including co-occurrence and sentiment analyses. These methods are useful in analysing the most important tech stories, providing informative, easy-to-interpret results. On the other hand, the pipeline of the analysis required a close evaluation and manual filtering of results.
In this study, we take a different approach: instead of examining time dynamics, we focus on the mapping of topics discussed in technology news. Finding themes in a large number of news stories is challenging, as they remain latent or hidden. Moreover, a given news is usually related to various general topics at the same time, e.g. a story discussing the Cambridge Analytica scandal can be classified both to social media, policy and business categories.
We have two main goals:
- Discover latent topics in news discussing emerging technologies and social issues,
- Map the relationship between these topics.
First, we implement topic modelling analysis to group articles into wide categories. Second, the t-SNE algorithm is used to map articles in a two-dimensional space, clustering articles on the same subject together. The combination of these methods not only helps us to evaluate the main areas of tech news (such as policy issues, AI or social media), but also to dive deeper by preparing separate maps of narrow fields.
We create an automated data pipeline with a reduced role of intermediate qualitative analysis. This means that while the implemented methods are complex and belong to the state-of-the-art of text mining, the new tools remain easy to use. As before, the results are presented in the form of interactive visualisations.
Our study begins with an introduction of the applied text mining methods. Next, results are presented in two parts: first, the broad topics discussed in tech news are described, followed by the qualitative analysis of five key NGI areas.
Our aim was to present the results in the most convenient form for different stakeholders. Therefore, we have prepared sections that are especially dedicated to: policy makers and tech enthusiasts; non-technical readers interested in data analysis; and data scientists with background in text mining methods.
We offer the following independent reading paths through our deliverable:
-
Policy makers can jump right into results section where we present and interpret our findings. We hope that providing a distilled image of the current tech landscape will be helpful in agenda-setting for innovative policy.
-
For non-technical readers interested in machine learning, we have prepared a theoretical overview section. It covers brief introduction to dimensionality reduction and topic modelling techniques.
-
Savvy data science readers might skip theoretical overview and head directly to the methods section. In this chapter we describe in greater detail the techniques we have utilized and how we fine-tuned the algorithms.
Theoretical overview
This section provides an introduction into the text-mining methods used in the study. We concentrated on two main techniques: topic modelling with Latent Dirichlet Allocation, and t-SNE for document clustering. Moreover, we also experimented with the deep learning method word2vec. For a more technical description, see the Methods section.
Introduction to dimensionality reduction
In this analysis, we are dealing with more than 200 000 articles published online - from short news to more detailed long-reads. The raw text of these articles, containing tens of thousands of individual words, serves as input for text mining. Text mining methods rely heavily on linear algebra, therefore the input information needs to be transformed into matrix form. The text data is represented as a bag-of-words (BOW) matrix, where each row is a document and each column corresponds to a different word and contains the number of its occurrences in the documents.
Even this representation loses some information: neither grammar nor word order is preserved. Still, our data is high-dimensional, with hundreds of thousands of unique terms. So many dimensions make it impossible to analyse trends or find patterns in the data: we need to discover its hidden, lower-dimensional structure.
A common method for reducing dimensionality is Principal Components Analysis (PCA). Data is transformed into multiple – usually 2 for visualization purposes, possibly more if we expect more factors to determine the data – components which must be unrelated to each other. Each successive component explains less and less variance in the data. Therefore, by selecting the first few factors, a large share of variance can be explained.
Non-negative matrix factorization (NMF) is closely related to PCA. NMF decomposes the matrix into two matrices that contain no negative elements and are easier to interpret. Another method, singular value decomposition (SVD) decomposes the matrix into three matrices with constraints. The matrix in the middle plays key role, as numbers on its diagonal represent scaling in the particular dimensions. Truncated SVD keeps only the largest numbers, less important dimensions are discarded.
These methods, while useful for their simplicity and explicability, have some drawbacks. For visualizing text data, they usually result in a cloud of vaguely connected articles. Our aim is to find well separated topics that clearly differentiate articles. One possible solution is the topic modelling method Latent Dirichlet Allocation (LDA), which is related to matrix factorization. Another possibility is the implementation of algorithms based on neighbor graphs, such as t-SNE.
In document clustering, our goal will be to present the articles in a two-dimensional space. We will rely heavily on truncated SVD and PCA as the initial steps in the process. Truncated SVD is used to simplify computations while maintaining structure of the data. Next, PCA is implemented to transform the data into two-dimensions.
LDA
Topic modelling methods enable the thematic mapping of large amounts of text data. Topic modelling assumes that documents, such as news articles, contain various distinguishable topics. As an example, a news article covering the Cambridge Analytica scandal may contain the following topics: social media, politics and tech regulations, with the following proportions: 60% social media, 30% politics and 10% tech regulations. The other assumption is that topics contain characteristic vocabularies, e.g. the social media topic is described by the words Facebook, Twitter etc.
LDA is a popular topic modelling method due to its ease of use, flexibility and interpretable results. LDA has been proposed by Blei et al. (2003), based on Bayesian statistics. The method’s name provides its key foundations. Latent comes from the assumption that documents contain latent topics that we do not know a priori. Allocation shows that we allocate words to topics, and topics to documents. Dirichlet is a multinomial likelihood distribution: it provides the joint distribution of any number of outcomes. As an example, Dirichlet distribution can describe the occurrences of observed species in a safari (Downey, 2013). In LDA, it describes the distribution of topics in documents, and the distribution of words in topics.
The premise of the topic modelling methods is simple: we describe and recreate our texts with a combination of topics consisting of specific words. More precisely, we aim at recreating our BOW word-document matrix with the combination of two matrices: the matrix containing the Dirichlet distribution of topics in documents (topic-document matrix), and the matrix containing the words in topics (word-topic matrix). The construction of the final matrices is achieved by a process called Gibbs sampling. The idea behind Gibbs sampling is to introduce changes into the two matrices word-by-word: change the topic allocation of a selected word in a document, and evaluate if this change improves the decomposition of our document. Repeating the steps of the Gibbs sampling in all documents provides the final matrices that provide the best description of the sample.
In our analysis, LDA will be used in a two-stage process. First, the entire sample of news articles will be divided into wide categories, such as business, policy or AI. The category of the document will be allocated based on the dominant topic - the topic with the highest share in the document. In the second stage, LDA will be implemented again for articles in the individual categories, to explore latent topics within them.
t-SNE
t-SNE has been introduced by Van der Maaten and Hinton (2008) and followed multiple attempts to find a dimensionality reduction algorithm that preserves local structure. This means that observations that are close to each other in the input high-dimensional place are also placed close to each other in the output low-dimensional space, but separate to other articles, e.g. articles about bitcoin should form a separate cloud to articles about AI. In contrast to earlier algorithms designed with preserving local structure in mind, it managed to gain traction and has been cited in almost 10 thousand articles according to Google Scholar.
SNE, the base algorithm for t-SNE, minimizes the difference between probability distributions for full-dimensional and low-dimensional data representations. The goal is to preserve conditional probabilities that a point would choose another point as its neighbor. A crucial parameter of the algorithm is perplexity, which can be understood as the number of nearest neighbors considered.
The crowding problem is a challenge for such algorithms – as an example, in a 3-dimensional space, one can find 4 points which are equally distant from each other (corners of a tetrahedron), while in 2 dimensions, only 3 such points may exist (triangle). Preserving this similarity in transformation from 3 to 2 dimensions is mathematically impossible, but there are ways to minimise its effects.
Another important goal is to maintain the global structure of data: the distance between topic clouds should be meaningful, e.g. the cloud with articles on bitcoin should be close to the cloud collecting documents on ether, and further from articles on AI. Recent developments in biology – where t-SNE is widely used in transcriptomics – describe improvements in visualization regarding the global structure. The procedure offered by Kobak and Berens (2018) begins with PCA as the starting point, and continues with “perplexity annealing” – output from high-perplexity t-SNE is used as initialization for lower-perplexity t-SNE.
Our results show that using this combination of methods has various advantages. First, we reduce the number of dimensions of our text data to 2 with SVD and PCA. Next, we implement t-SNE with high perplexity, creating a two-dimensional map, where each document has a large number of neighbours. Finally, we repeat the t-SNE with low perplexity, reducing the number of neighbours. The results show that articles covering similar topics will be placed close to each other by the algorithm, maintaining the distance between distant topics.
Word vectorization
Documents can be represented as bag-of-words model described above. Even without any further transformations, we can compute similarities between documents by word co-occurrence, and through further transformations compute similarity (e.g. cosine metric) in latent dimensions. Similarly, computing similarities between words is possible, although word representations have to be constructed in a more complex way.
Word2vec is a powerful deep learning method that is widely used in next-word prediction, e.g. in predictive typing applications. Neural networks are used by Word2Vec to find the latent structure in words. Neural networks have an input layer, an output layer, and one or more hidden layers in between. They are loosely based on the design of the human brain. The basic machine learning architecture is neural network language model by Bengio, Ducharme, Vincent and Jarvin (2003). Previous algorithms have high computational complexity due to the non-linear hidden layer, while Word2Vec reduces this complexity by removing the non-linear hidden layer – maintaining only the linear layer – and sharing the projection (discrete-continuous transformation) layer for all words.
The basic choice in model architecture is between continuous bag-of-words (CBOW) and skip-gram. CBOW uses multiple neighbouring words as input to predict one word, while skip-gram uses one word as input to predict multiple neighbouring words (Mikolov et al., 2013). The predictions are only artificial and in fact are not used anymore. Weights of the hidden layer are used as word representations. This trick allows us to get some kind of latent dimensions in an unsupervised way – the user does not have to define what they expect.
When words are represented as n-dimensional vectors, they can be added together. With Word2vec, we can analyse word pair relationships, such as similarity (e.g. synonyms) or analogies (e.g. “king”-“man”+“woman”=“queen”). Dimensions are not easily interpretable, but word-pair relationships can be derived from vector arithmetic. Mikolov et al. (2013) conclude that subtracting two word vectors and then adding the result to another vector can find word pair relationships with high accuracy. For example, Paris - France + Italy = Rome, if Japan is added instead of Italy, the result is Tokyo. Changing Italy to Florida makes the mathematical operation return Tallahassee (the capital of the state).
Multiple word2vec models have been trained on various data sets, such as Google News and Wikipedia. Using domain-specific data sets, we can obtain more precise representations. Synonyms are one of the most difficult problems in word representations – if one word is represented by one vector, can this vector represent multiple meanings? For example, Amazon can be a company, a river or a rainforest. Similarity between Amazon (company) and Microsoft would be high, but between Amazon (river) and Microsoft rather low. In the case of pre-trained representations, if Wikipedia has been the source, it may show a bias towards geographical terms – which is undesirable in our case. The tech news data set that we used should mitigate this issue, but it was uncertain how it will work compared with other data sets. The Google News data set has almost 3 million words and phrases without lemmatization, while lemmatized corpora contain about 300 thousand words. Comparatively, our data set is small. Fortunately, it has delivered sufficient performance for our use case.
The usage of word2vec will be experimental in our study. We will demonstrate its potential on various examples of word relations, including word similarities, analogies and word pairs. As the results are more technical, we present them in Methodology section.
Methods: technical description
This section presents the more technical description of the used methods. Readers less interested in the text mining process may skip directly to the Results section.
Here we also introduce the results of experimentations that are less relevant for the qualitative analysis of our results.
LSA
Our first approach was pure Latent Semantic Analysis (LSA) based on truncated SVD. After creation of a bag-of-words matrix transformed by term frequency- inverse document frequency (tf-idf), we computed how 100-dimensional SVD behaves after 10 iterations (default solver is randomized). We have realized that for simple topics, it has significant value – most similar articles measured by cosine similarity to an article about AI in self-driving did result in mostly correct solutions. However, it could only be used as a starting position for further computations – there are too many dimensions to visualize. It also lacks interpretability for the typical dimension numbers. Nevertheless, it provides a reasonable base for further algorithms.
LDA
For easier interpretation of results, we implemented Latent Dirichlet Allocation. First, stopwords were removed from the corpus. As in LSA, the bag-of-word matrix was transformed with tf-idf. Gensim, which has been created by leading natural language processing researchers, has been the chosen library due to its effectiveness in multicore computations and wide array of settings. Three key parameters were controlled by us:
- Number of topics
- Alpha: prior topic-document distribution
- Eta: prior word-topic distribution
The parameters were adjusted depending on the size of the corpus. A wide array of topic numbers were tested (from 10 to 150), and we found that topic numbers between 20 and 30 resulted in good topic separation. In the case of the prior distributions, the default setting is equal to symmetric 1/number_of_topics in the case of alpha and eta. Besides the default settings, we experimented with the “auto” setting (Gensim learns asymmetric priors from the corpus), and with decreasing the value of the symmetric priors. In general, lower alpha and eta values lead to fewer topics in documents, and less words per topic that can be often beneficial. Asymmetric priors were dismissed due to the tendency to select few topics with very large shares in documents. We experimented with various applications of LDA in our analysis that are presented below.
One stage LDA with time dimension
Initially, our idea was to examine how various topics evolved over time based on their shares in documents. We performed LDA over the entire corpus and grouped articles into topics based on the dominant topic or minimum topic share (e.g. if topic 1 had at least 10% share in a document, the document was assigned to topic 1 - articles could belong to multiple topics). Next, we calculated the monthly share of articles that belonged to a specific topics, and visualised the changes over time.
On the one hand, the method worked well in the case of certain stable topics. As an example, the changing share of articles covering Apple products reflected the company’s release cycle, with peaks in every September. However, in the case of most topics, the dynamic fluctuation lacked pattern and seemed to be random (e.g. cloud topic). For this reason, we did not pursue this idea further.


Two stage LDA
Our effort to discover narrow, specific topics was not successful with a large number of topics (50-100). While a few topics were well separated, the vast majority of topics were charaterised by mixed keywords, making further analysis difficult. However, decreasing the number of topics resulted in a clearly defined, but broad topics. Therefore, we opted for a two-stage process.
During the first stage of topic modelling we have implemented LDA on the whole text corpus. Our aim during this stage was to obtain a satisfactory level of topic separation, i.e. a situation in which topics are neither all issues lumped together nor overly fragmented ones. In order to achieve that we have experimented with different LDA hyper parameters levels. For settings with 20 topics and default priors, the topics were balanced and separable. We managed to reach gradually decreasing topic sizes: the largest topic has a share of 19%, the 5th 8%, and the 10th 5%. In the case of higher topic numbers, the distribution of topics was much more skewed towards few dominant topics.
From the topic keywords, we were able to easily determine the described domain areas, such as AI, cybersecurity or policy issues. Based on the dominant topic, we were able to group articles into five well-defined, broad categories: AI, Policy, Social media, Business and Cybersecurity.
To pursue the analysis further, our aim was to discover the more narrow, specific topics within the defined groups – e.g. topics within the AI group only. We performed a second stage LDA: topic modelling on each group individually. Based on our experimentation, returning to the original bag of words matrix provides more separated topics. Therefore, we selected the rows with the relevant articles and performed the tf-idf transformation separately for each group. Depending on the groups of articles, different LDA parameters were used:
| Area |
N.documents |
N. topics |
alpha |
eta |
| AI |
46957 |
10 |
default |
default |
| Policy |
53736 |
15 |
0.006 |
default |
| Cyber |
12996 |
15 |
default |
default |
| Business |
33090 |
15 |
0.01 |
0.01 |
| Media |
12914 |
15 |
0.01 |
0.01 |
The results of the second stage LDA were promising for some of the wide areas: e.g. for articles belonging to Policy, the algorithm showed keywords related to such areas as 5G, the FCC or EU regulations of big tech. However, for articles on cybersecurity or social media, the second stage topics did not bring new information. For the qualitative analysis of results, see the Results section.
For visualising the results, the pyLDAvis package was used. The positions of circles were determined by computing the distance between the topics with the help of multidimensional scaling technique (MDS), and then the inter-topic distances were projected onto two dimensions (see: Chuang et al., 2012).
t-SNE
LDA’s shortcoming is the need to choose the number of topics in advance. It does not have sufficiently good performance for a large number of topics at once, which is why we experimented with two stages of LDA. Moreover, the need to assign each document to a topic reduces robustness.
In search for the solution for the above mentioned problems we turned towards experiments with more advanced dimensionality reduction techniques. First we tried UMAP (Uniform Manifold Approximation and Projection, which is a novel, topology-based method. We did not choose UMAP as the basic method due to the results of an initial series of trials. The experimentation revealed the ineffectiveness of UMAP in separating more difficult topics, placing most articles in the middle of the two-dimensional charts. The local forces are most likely not strong enough to outweigh global ones and it fails to discover the structure, in spite of the structure existing as proven by t-Stochastic Neighbor Embedding (t-SNE).
On the other hand, our experiments with t-SNE showed that it is more suitable to our needs and is able to identify clusters of articles on specific topics. We have chosen openTSNE library, which is advertised as “extensible and parallel”. Thanks to speed and scaling improvements over common t-SNE implementations such as scikit-learn’s manifold.TSNE, we have been able to do computations fairly quickly (less than an hour for a data set with about 50 thousand observations), even though we still have been memory-limited – particularly due to truncated SVD computations, which failed on the full data set. The results we present are based on the following steps:
- Read all articles, count word occurrences
- Transform counts using tf-idf
- Compute truncated SVD with 250 components
- Initialize perplexity based nearest neigbours with cosine metric and perplexity 300
- Initialize embedding based on Principal Component Analysis
- Optimize embedding:
6.1. 250 iterations, exaggeration 12, momentum 0.5
6.2. 750 iterations, momentum 0.8
- Reduce perplexity value to 25
- Optimize embedding with 500 iterations and 0.8 momentum
Comparing these results to t-SNE with default optimizations, which also uses two separate embedding optimizations (250 and 750 iterations), we do not see a large difference. Probably the reason is PCA initialization. Nevertheless, maintaining more global structure is a preferable outcome, so the perplexity annealing method is used as default.
The maps prepared with t-SNE present article clusters with desirable features (available in Results section. Separate, but related topics appear close to each other, as in the case of articles on Tesla and Uber on the Policy map (two companies in the transportation industry).
All computations had been conducted on the entire data set of articles in a given group. However, for performance issues and readability, the visualisations present only a randomly chosen subset of articles.
Word2vec
LDA and t-SNE enable us to discover latent topics in our articles and to explore relations between various clusters of articles. Word2vec might give us an opportunity to analyze our text corpus on a much finer level of granularity. Thanks to pseudo-algebraic operations between words made possible by word2vec we can e.g. experiment with discovering common relationships between certain pairs of concepts, i.e. move from topic modelling to semantic analysis. Please note that this deliverable covers only initial results of the analysis, we plan to experiment with vectorization methods in further work.
We used CBOW (continuous bag-of-words) as the base model – skip-gram achieves consistently worse results by expert analysis on examples we checked. We suppose the cause is the relatively small size of the data set – skip-gram is more complex and uncertain, and although large quantities of data in massive data sets alleviate these problems and allow using this architecture, with smaller data sets we are better off using CBOW.
Testing the model trained on Google News data set (Mikolov et al., 2013), some pairs miss the point: Microsoft-Ballmer relationship for Google returns Yahoo, and for IBM – McNealy (founder of Sun Microsystems). In the model trained on our dataset, vector arithmetic with Google returns Sergey Brin as the first result, with Singhal and Giannandrea being the next closest matches (former and current heads of Search team). The result for IBM is still incorrect – Gordon is the closest match (Ginni Rometty is the current CEO of IBM, Gordon Fuller is the Chief Learning Officer in the company). The model based on Google news also makes a mistake with company-desktop operating system relationship for Apple; our model returns Mac, which is also not the ideal solution (MacOS would be, and the word indeed exists in the dictionary – with the reverse arithmetic, macos - apple + microsoft = windows).
Arithmetic on basic concepts, like brother - man + woman does not return the expected result (sister), even though all proposed terms – daughter, girlfriend, wife, husband – are related kinship/relationship concepts. Domain-specific similarities are well-preserved, for example uber - ridesharing + dating = tinder, as well as some generic terms: washington - united_states + european_union = brussels.
Top 10 most similar words to Trump by CBOW model includes Obama, Vladimir Putin and Clinton, while only 1 word in skip-gram is a different person than Donald Trump – skip-gram includes terms like campaign trail, nominee Donald or Republican nominee. It finds synonyms better, but that was not our goal – finding related terms is preferable.
Vectorization of particular relationships is shown in the figures below. The 100-dimensional vector has been transformed by PCA to 2 dimensions for each group separately. Arrows represent the expected relationship between terms. Arrows are meant to be roughly similar for all connected relationships.


Results: qualitative analysis
We summarise the main results in the next sections, focusing on policy-relevant findings. First, we identify key areas discussed in tech news using topic modelling. Next, we examine the relationships between topics by mapping article clusters. In the following parts, we dive deeper into five key NGI areas, providing more detailed insights.
Broad topic identification
We begin our analysis with topic modelling conducted on all articles in our data set. The visualisation below presents 20 identified topics: each circle represents a topic, with decreasing order relative to size (Topic 1 is the most prevalent in the documents). The distance between topics is determined by the similarity of vocabularies: topics sharing the same words are closer to each other. In the right panel, the bars represent the unique terms that are characteristic for the selected topic. A pair of overlapping bars represent both the corpus-wide and topic-specific frequency of a given term.
We labeled each topic based on the top-30 most relevant terms. Upon closer examination, we have reduced the number of topics to 17 (topics 5 & 16 became the joint category Space tech, topics 10 & 19 were melded together to form a topic on Media and 14 & 15 became a joint Hardware category). In the following sections we provide brief descriptions of the identified topics.
 AI & robots
Topic 1: AI & robots constitutes the largest topic containing around 19% of all words and is characterized by machine learning jargon (e.g. train data), as well as popular ML applications (robots, autonomous cars).
 Social media crisis
Topic 2: Social media is similarly prevalent and covers the contentious aspects of modern social media platforms (facebook, twitter), such as right to privacy, content moderation, user bans or election meddling with the use of microtargeting (i.a.: privacy, ban, election, content, remove).
 Business news
Topic 3: A large share of tech articles covers business news, especially on major platforms (uber, amazon), services such as cloud computing (aws) or emerging technologies as IoT or blockchain. The topic words also suggest great focus on the financial results of tech companies (revenue, billion, sale, growth).
 Smartphones
Topic 4: Two major manufacturers - Samsung and Apple are on the top of the keyword list with equal number of appearances. Articles are focused on the features, parameters and additional services provided by devices (camera, display, alexa etc.).
 Space
Space
Topic 5 & Topic 16: Space exploration excitement is common in the tech press. The joint Space topic contains reports about NASA, future Mars and Moon missions, as well as companies working on space technologies (e.g. SpaceX).
 Privacy
Topic 6: this topic revolves around the Cambridge Analytica privacy scandal and gathers all mentions of this keyword in the corpus. The involvement of Cambridge Analytica in the Leave campaign during the Brexit referendum is of major focus, as suggested by the high position of keywords such as EU and UK. Unsurprisingly, GDPR is also often mentioned in the articles dealing with the aftermath of the CA controversy.
 Cybersecurity
Topic 7: The Cybersecurity area explores cyberspace security issues related to both widely-used computer systems, as well as novel decentralized technologies, e.g. based on blockchain.
 5G
5G
Topic 8: The much anticipated fifth-generation wireless network has huge potential to transform all areas dependent on ICT. The 5G topic deals with global competition over delivering 5G tech to the market (huawei, ericsson). It captures also the debate about 5G’s impact on net neutrality. 5G’s main quality is to enable signal ‘segmentation’, causing debate whether it can be treated like previous generations of mobile communications by net neutrality laws.
 Digital Ecosystems
Topic 9: The focus of the area is on operating systems, both mobile (ios, android), desktop, (windows, macos) as well as dedicated services (browsers chrome, mozilla) and app stores (appstore).
 Media
Media
Topics 10. & 19: The joint media topic revolves around the most important media platforms: streaming and social media. The global video streaming market size was valued at around 37 billion dollars in 2018, while the worth of music streaming is estimated at 9B, accounting for nearly half of the music industry’s revenue (Grand View Research 2019). Particularly, this topic focuses on major streaming platforms (youtube, netflix, spotify), social media (facebook, instagram, snapchat), the rising popularity of podcasts and business strategies of streaming services (subscriptions, ads).
 Microsoft
Topic 11: During its 40 year history, Microsoft has made above 200 acquisitions. Some of them were considered to be successful (e.g. LinkedIn, Skype), while others were less so… (Nokia). Topic 11 collects articles describing Microsoft finished, planned and failed acquisitions in the recent years (github, skype, dropbox, slack).
 Autonomous vehicles
Topic 12: Autonomous transportation is a vital point of public debate. Policy makers should consider whether to apply subsidies or taxes to equalize the public and private costs and benefits of this technology. AV technology offers the possibility of significant benefits to social welfare — saving lives; reducing crashes, congestion, fuel consumption, and pollution; increasing mobility for the disabled; and ultimately improving land use (RAND, 2016). Topic 12 addresses technological shortcomings of the technology (batteries) as well as positive externalities such as lower emissions (epa, emissions).
 Tesla
Tesla
Topic 13: the topic modelling analysis identified Tesla and other Elon Musk projects as a separate topic. Besides Tesla developments of electric and autonomous vehicles, the topic also includes words related to other electric mobility solutions (e.g. Lime).
 CPU and other hardware
Topics 14. & 15: Topic 14 covers the CPU innovation race between Intel and AMD, as well as the Broadcom-Qualcomm acquisition story (the acquisition was blocked by Donald Trump due to national security concerns). Topic 15 includes news regarding various standards (usb-c) and storage devices (ssd).
 Startups
Topic 17: this area concentrates on startup ecosystems and crowdsource financing. Articles discuss major startup competitions such as Startup Battlefield or Startup Alley, and crowdfunding services such as Patreon.
 Wearables
Topic 18: We observe a surge in the adoption of wearables, such as fitness trackers, smart watches or augmented and virtual reality headsets. This trend brings important policy questions. On one hand, wearables offer tremendous potential when it comes to monitoring health. On the other hand, it might be overshadowed with concerns about user privacy and access to personal data. Articles in topic 18 discuss news from the wearable devices world regarding new devices, novel features etc. (fitbit, heartrate).
 Gaming
Topic 20: the final topic deals with the gaming industry. It covers inter alia popular games (pokemon), gaming platforms (nintendo), various game consoles (switch) and game expos (e3).
Mapping all articles
We were able to observe the most prevalent topics from the topic modelling analysis. However, it is difficult to unravel further details based on the analysis of topic-words. To examine which articles discuss the various topics, we turn to document clustering with t-SNE.
The map presents the articles in two dimensions: neighbouring articles are characterised by similar vocabulary and are likely to cover the same subject. Additionally, we also mark the results of the topic modelling analysis with colours: it marks the dominant topic of the document. For better visibility, the map presents different colours for the 8 most frequent topics, while the rest is merged into one category (‘Other’). The map also enables to view the article titles below the chart.
Open in new tabThe map shows that LDA and t-SNE similarly grouped our documents: articles with the same colour are placed close to each other by t-SNE. We can identify large groups of green, blue, purple etc. articles. This supports the robustness of the text mining strategy.
Moreover, the map proves the aptitude of our methods to provide clusters of articles with different levels of granularity. Based on the analysis of clusters, we are able to identify more specific areas inside the wide umbrella topics determined by LDA. As an example, LDA returned a broad category of articles dealing mostly with social media crisis issues. t-SNE helps us to further classify these articles into smaller clusters: focused on specific social media platforms (e.g. articles on Twitter can be found at (50,-10), on Facebook at (50,10), or on president Trump’s usage of social media (0,-30).
Another advantage of t-SNE is demonstrated by the cluster on the Apple-FBI Encryption Debate (35,10). Based on the LDA topic terms, we named the entire green topic as social media crisis, while this group of articles also includes other tech policy areas. t-SNE helps us in recognising these more nuanced details.
It is also worth noticing how t-SNE grouped together articles from various LDA topics that share a common feature. One such example is the cluster on Google (20, 10) that includes stories on the problems of Youtube, business news or articles on Google’s software development for smartphones.
Clouds proximity to each other also seems to be meaningful and informative as it can be observed by the example of the AI & robots cluster. In the upper left part of the figure (-35,30) a group of articles covering robotics can be found. The left part of the cloud consists of articles discussing mostly the transformative potential of robotic technologies (e.g. job automation), whereas the right part pertains to hardware issues (e.g. batteries). The whole robotics cluster is close to an another blue cluster related to conscious AI and real autonomous AI (-30,20). As we can see, distance in space resembles here the “thematic distance”.
Similar regularities can be observed in the remaining clusters regarding: business news, smartphones, cybersecurity, cross platform development, streaming and space exploration.
For example, in the case of cybersecurity articles there is a clear division between the cluster regarding security of decentralized networks (0,-55), and the cluster dealing with data breaches (15,-15). The latter one is positioned logically next to the cluster of articles concerning online privacy issues (10,-15).
In the smartphone subcategory, we can observe that articles related to various VR technologies (0,55) are close to the articles on smartphone camera technologies (0,40). Articles on new features and sales of successive iPhone generations are gathered at (35,20), just to the right of a cluster related to iOS.
Deep dives into key NGI areas
In the first stage of the analysis, we identified the broad topics recurring in the technology media discussions. Next, we analyse selected key areas at a more granular level. We focus on five areas that are especially important from the NGI perspective:
- AI and Robots
- Policy
- Media
- Business
- Cybersecurity
The Policy area groups together articles with different dominant topics: Social media crisis (Topic 2), Privacy (Topic 6) and 5G (Topic 8).
In the deep dives, we separately analyse the articles that belong to the 5 wide thematic groups. We repeat the steps from the previous mapping: first, we implement topic modelling, then cluster articles with t-SNE. Therefore, we should obtain more domain specific, narrow topics and article clusters. In our analysis, we will focus on the maps; for the detailed list of topic-words, please see the Annex.
AI & robots
Open in new tabFollowing the identification of articles with dominant AI topic, a second-stage LDA analysis is carried out to unravel narrower AI-specific subjects. The five most important topics are: AI companies (company, data, startup), robotics (robot, system), data (network, process), user centric (people, human) and science (star, scientist, blackhole). As the topic-words show, the discovered topics are still rather general. To better understand the content of news stories on AI, the articles are also clustered with T-sne.
The map confirms again that LDA and t-sne similarly groups the documents, as articles with the same color are placed close to each other.
Analysing the smaller clusters of articles within the various color groups, specific smaller topics can be found. Among the blue clusters, we can discover such topics as AI and health (-30, 10) or the ethical challenges of AI (0, 40). The health cluster includes the developments of various companies (e.g. advancements in Google’s AI in diagnostics), news on smart wearable devices, the pressure on public health care for digitalisation. The ethical AI cluster reports on calls for regulatory control over AI development and various industry initiatives (e.g. the adoption of principles for ethical AI by SAP or the OpenAI group).
Coming to clusters associated with the orange colour (robotics), the following sub-fields can be explored: robot developments (40, -20), drones (50, 0), car industry (25, 20) or VR applications (5, 50).
The exciting new technologies include among others soft robots, bipedal locomotion and biohybrid robots. In terms of human-AI interaction, the articles covered the recent successes of AI over human players in GO and Dota, the usage of AI and robots in sports and also developing the skills’s of AI by human games (e.g. pictionary).
The robotics group well demonstrates that articles with the same dominant topic can form clusters in distinct areas of the map. This shows why t-SNE is helpful: while it keeps articles with the same latent topic close to each other locally, it also maintains global differences. For example, VR (5, 50) is close to a cluster on games (15, 50), and the car industry (25, 20) is next to a cluster collecting articles on Tesla (20, 30). This solves the problem stemming from grouping articles based on dominant topics: as a document is a mixture of topics, there is a wide array of edge cases where the same article could land either in the robotics group, as well as in the group AI companies.
The green clusters are centered around various technologies: quantum computers (-50, -15), IoT (-15, 15) and cloud computing (-15, 20). Open source technologies (such as Kubernetes, Linux or OpenStack) are discussed in the cluster (-25,40).
It is also worth exploring two clusters on science: purple (-35, -40) discussing astronomy news and red covering genome research (-20, -40).
Policy
Open in new tabFor articles with dominant topics related to policy, the second stage LDA provides one big category (social media), and a number of small ones (tech investigations, 5G, investment funds and FCC).
First, let us focus on the large blue group of articles that focus on major platforms. Upon inspection of smaller clusters, the articles covering specific companies can be identified: YouTube (-10, 40), Twitter (-5, 50), Facebook (-30, 40), Tinder (0, 60), Google (10, 50), Amazon (40, 20), Airbnb (50, 20) and Uber (50, 10).
The titles of articles reporting on social media platforms show recurring challenges: fake accounts, the spread of extremist content, misinformation and election meddling. The map enables the exploration of individual stories, e.g. the Zuckerberg testimonies, the Cambridge Analytica scandal, or the spread of anti-vaccine conspiracy theories. In the case of Google, the articles reported on various biases (search results and ads), workplace sexual harassment scandals, and Google’s involvement in military AI projects.
The challenges are different for e-commerce giant Amazon: the articles focus on employment rights, data leaks, controversial tax arrangements and dangerous products.
Finally, the clusters on Airbnb and Uber contain articles on regulatory battles in cities and the gig workers’ rights.
In the case of the Uber cluster (50, 10), t-SNE grouped together articles from various colour groups, showing again the usefulness of the method. Therefore, all news stories on Uber can be evaluated together, even if LDA provided different topic shares. The cluster contains articles not only on worker rights, but also on passenger safety concerns, the Waymo lawsuit over IP theft, and various unethical conducts by the company (e.g. spying on rival Lyft’s drivers by hacking their IT system).
Coming to the tech investigations, distinctive groups are formed among others on tech patents, the Apple vs FBI battle, and on the legal issues around Microsoft.
Finally, two remaining LDA groups are well separated: 5G and FCC (Federal Communications Commission). In the context of 5G, especially important is the competition among the telecommunication companies, as well as national security (e.g. the debate on China’s Huawei). Articles on FCC mostly focus on net neutrality.
Open in new tabThe LDA analysis grouped articles into the following main clusters: blue- Facebook (facebook, instagram, ad), orange - Apple services (service, video, music), green- ads (tv, facebook), red - Twitter (twitter, launch) and purple - streaming services (service, feature, launch).
Based on the keywords, it is rather difficult to capture the differences between groups, however, the t-SNE clustering helps us to better understand the underlying topics. Most importantly, t-SNE grouped together articles on the same platform and services: Pinterest (-10, 50), Instagram (30, 0), Facebook (various clusters in the blue group), Twitter (30, 40), Spotify (-30, -40), Apple Music (-40, -20), Tidal (-20, -40), Apple TV (-55, -10), Hulu (-40, 0), Netflix (-30, 10).
Moreover, competing platforms are in close proximity to each other: we can differentiate articles on music streaming in the lower left corner, and video streaming in the right (with news on Netflix, Disney, Youtube TV, Fox, Comcast, Apple TV). Also, a cluster on podcasts can be identified close to articles covering the two main players: Apple and Spotify.
It is worth noticing that while the previous policy section was dominated by articles covering the problems of social media, the articles of this section has a much greater emphasis on general business news. This shows that LDA can be useful to create wide groups of documents for further analysis.
Business
Open in new tabThe largest category identified in the second-stage LDA collected articles regarding investments in the tech industry. In this cluster you can find news about investments and acquisitions in specific sectors, e.g. short-term rentals (Airbnb and Guestly) (40,30), ride sharing platforms (Lyft, Uber) (0,60) or e-scooters (Lime, Spin) (-10,70).
The second most prevalent category collects articles about the business aspects of cloud computing. The cloud computing cluster provides insights into the cloud computing arms race and investments of cloud providers, e.g. AWS (20,-40), Oracle (5,-70) or Telstra (30,-50).
It also includes stories about new functionalities of different cloud providers, targeting mostly the needs of business clients, e.g. Google’s Dedicated Interconnect service (25,-30).
Although smaller, remaining clusters also exhibit good separation. Within the smartphone industry cluster, we find subclusters pertaining to specific manufacturers’ investments, e.g. Samsung (-35,30) or Apple (-45,10), as well as histories of long legal battles like the one between Apple and Qualcomm (-80,0). Articles in this subcluster discuss a battle over patent licensing between Apple and Qualcomm, and raise an important policy question: how a fair division of profits should look like in the smartphone industry.
The orange cluster contains stories of competition and business strategies in different digital industries. As an example, the articles around (-25,30) concern the financial situation of the audio streaming industry. The cluster also covers articles about the expansion of Chinese giants, e.g. Alibaba (20,30) or Tencent (-20,30).
Cybersecurity
Open in new tabTopic modelling helped us to identify five categories among articles focused on cybersecurity. Two major ones pertain to malware and decentralized world of cryptocurrencies and blockchain. The three others cover infamous data breaches, system vulnerabilities and the Australian cybersecurity strategy.
The malware category is further mapped with the help of t-SNE into subclusters concerning ransomware targeting different operating systems, apps, devices etc. Examples include Android vulnerabilities (like banking trojan Triada) (5,50), Wordpress targeted malware (25,40) or autonomous vehicles security, e.g. articles covering American lawmakers efforts to address vehicle hacking (50,20).
Other subclusters contain articles on different strategies used by attackers, e.g. encrypting the files of infected users for backmailing (e.g. Locky) (-55,20). On the side of defenders, we can find e.g. cluster on bug bounty initiatives and articles about ethical aspects of hacking, e.g. FitBit rewarding external vulnerability reports concerning its devices (45,20).
The second major t-SNE subcluster concerns in a large part the security of the crypto world: reports on stolen cryptocurrencies, as well as stories about illegal activity funded with bitcoin (e.g. election interference, ransom) (20,-40). The security of blockchain-based services in the financial, medical and voting systems subfields is covered in (5,-60).
The next cluster maps stories of massive data breaches, e.g. articles discussing causes and the aftermath of Yahoo data breach, affecting 32M accounts (55,-20) or traditional banking cybersecurity, e.g. disconcerting accidents of hacks on SWIFT network (-20,-60).
Besides data breaches motivated by financial gains, we can find subclusters populated with articles covering data leaks by whistleblowers, e.g. WikiLeaks revealing hacking and mass surveillance methods used by US government agencies (-30,50). The nearby cluster gathers information on Julian Assange’s Ecuador saga (-5,-35).
Two other, smaller clusters concern specific system vulnerabilities (-25,60) and Australian government’s efforts to position itself as a world leader in cyber threat detection, prevention and response, e.g. (-20,20).
Conclusions
This study presented a methodology for mapping the topics discussed in technology news. We discovered key areas of emerging technologies and social issues, and mapped the relationships between them.
First, we provided a bird’s eye view on the technology world with topic modelling. Topic modelling serves as an appropriate basis for exploring broad topics (e.g. social media crisis, AI or business news) and grouping articles for further analysis. At this stage, we were able to identify major umbrella topics that ignite the public debate.
Second, we investigated the subtopics within key areas crucial for the Next Generation Internet initiative: AI, Policy, Business, Cybersecurity and Media. In order to explore more nuanced areas within the broad topics, we not only implemented topic modelling, but also clustered articles using t-SNE. Using this joint technique, we prepared a series of maps presenting articles from chosen categories.
This approach proved to be successful regarding the identification of smaller article clusters, and provided more details than the sole implementation of topic modelling. Our results show that this combination of methods is well suited for mapping the tech news landscape.
We also experimented with the deep-learning method Word2vec for the analysis of particular semantic relationships in tech news. The Word2vec algorithm trained on our corpus brings promising results in comparison to the baseline solution, i.e. algorithm trained on the Google News data set.
The presented methods can be easily implemented for further investigation in the future. The study can be replicated for other technological areas or completely different text data as well.
About
NGI Forward has received funding from the European Union’s Horizon 2020 research and innovation programme under the Grant Agreement no 825652. The content of this website does not represent the opinion of the European Union, and the European Union is not responsible for any use that might be made of such content.

Annex
Table 1. AI topic keywords
| AI companies |
Robotics |
Data |
User centric |
Science |
| company |
robot |
data |
say |
star |
| say |
system |
system |
people |
data |
| data |
say |
development |
look |
team |
| system |
development |
company |
online |
system |
| help |
companies |
network |
human |
observe |
| people |
team |
custom |
day |
scientist |
| team |
human |
say |
first |
look |
| product |
help |
process |
start |
image |
| startup |
device |
product |
something |
blackhole |
| development |
test |
team |
made |
planet |
Table 2. Business news topic keywords
| Tech investments |
Market competition |
Cloud computing |
Smartphone industry |
Tesla |
IoT |
Financial results |
| raise |
billion |
custom |
apple |
plan |
iot |
billion |
| invest |
investor |
aws |
percent |
invest |
plan |
share |
| custom |
more than |
cloud |
billion |
tesla |
develop |
custom |
| plan |
plan |
data |
samsung |
billion |
first |
per share |
| more than |
apple |
need |
analyst |
investor |
custom |
first |
| first |
invest |
network |
share |
firm |
data |
percent |
| work |
share |
manage |
2018 |
first |
work |
plan |
| data |
first |
more than |
first |
more than |
work |
more than |
| investor |
raise |
plan |
quarter |
offer |
more than |
report |
| offer |
percent |
offer |
report |
share |
need |
analyst |
Table 3. Cybersecurity topic keywords
| Malware |
Cryptocurrencies |
Data breach |
Australian cybersecurity |
System vulnerabilities |
| user |
malware |
user |
service |
user |
| malware |
say |
data |
say |
malware |
| hacker |
network |
breach |
au |
say |
| data |
service |
say |
malware |
infect |
| say |
user |
hacker |
australian |
code |
| service |
hacker |
custom |
data |
make |
| make |
data |
service |
make |
two |
| such as |
make |
inform |
breach |
update |
| infect |
such as |
leak |
user |
bug |
| network |
cryptocurrency |
malware |
custom |
vulnerability |
Table 4. Media topic keywords
| Facebook |
Apple |
Ads |
Twitter (#4) |
| video |
service |
service |
video |
| facebook |
apple |
facebook |
facebook |
| feature |
video |
video |
service |
| instagram |
feature |
tv |
feature |
| service |
music |
feature |
twitter |
| way |
tv |
ad |
tv |
| ad |
launch |
year |
apple |
| work |
offer |
offer |
launch |
| launch |
facebook |
way |
offer |
| offer |
instagram |
get |
way |
| Instagram (#6) |
YouTube (#7) |
Topic #8 |
Streaming services (#5) |
| video |
video |
video |
service |
| service |
servic |
facebook |
feature |
| instagram |
feature |
feature |
tv |
| feature |
instagram |
instagram |
offer |
| facebook |
facebook |
servic |
apple |
| way |
launch |
way |
music |
| launch |
ad |
ad |
video |
| apple |
offer |
work |
facebook |
| ad |
way |
launch |
launch |
| people |
youtube |
offer |
year |
Table 5. Policy topic keywords
| Social media |
Big tech investigations |
5G |
Investment funds |
FCC |
Big tech regulations |
Tesla (#7) |
| facebook |
apple |
5g |
invest |
fcc |
eu |
tesla |
| time |
state |
huawei |
fund |
net neutrality |
google |
musk |
| user |
time |
network |
time |
internet |
commission |
time |
| work |
investigation |
custom |
work |
pai |
regulate |
tweet |
| report |
judge |
zte |
australia |
state |
user |
report |
| go |
court |
time |
tax |
regulate |
time |
work |
< tr>
uk |
report |
connect |
busy |
comment |
tax |
comment |
| country |
uber |
technology |
tech |
rule |
countries |
go |
| account |
allegation |
work |
go |
commission |
facebook |
trump |
| state |
comment |
tmobile |
student |
consumer |
state |
investigate |
References
Bengio, Y., Ducharme, R., Vincent, P., Janvin, C. (2003), A neural probabilistic language model. Journal of Machine Learning Research 3: 1137–1155.
Blei, D., M., Edu, B., B., Ng, A. Y., Edu, A., S., Jordan, M., I., Edu, J., B. (2003), Latent
Dirichlet Allocation. Journal of Machine Learning Research 3.
Chuang, J., Manning, C., D., Heer, J. (2012), Termite: Visualization Techniques for Assessing Textual Topic Models. AVI ‘12, Capri Island.
Downey, A., B., (2013), “Think Bayes”, O’Reilly Media Inc, USA.
Gaussier, E., Goutte, C. (2005), Relation between PLSA and NMF and implications. Proceedings of the 28th annual international ACM SIGIR conference on Research and development in information retrieval. ACM.
Grand View Research, (2019), Video Streaming Market Size, Share & Trends Analysis Report By Streaming Scope, By Solution Scope, By Platform Scope, By Revenue Model, By Service, By Deployment, By User, And Segment Forecasts, 2019 - 2025.
Gyódi, K., Nawaro, Ł., Paliński, M., Wilamowski, M. (2019), Informing Policy with Text Mining: Technological Change and Social Challenges. Available at SSRN: https://ssrn.com/abstract=3362487 or http://dx.doi.org/10.2139/ssrn.3362487
Hotelling, H. (1933), Analysis of a complex of statistical variables into principal components. Journal of Educational Psychology, 24(6), 417-441.
Jolliffe, I. (2011), “Principal component analysis”. Springer Berlin, Heidelberg.
Kobak, D., Berens, P. (2018), The art of using t-SNE for single-cell transcriptomics. BioRxiv.
Maaten, L., Hinton, G. (2008), Visualizing data using t-SNE. Journal of Machine Learning Research 9.Nov, 2579-2605.
Mikolov, T., Kopecky, J., Burget, L., Glembek, O., Cernocky, J. (2009), Neural network based language models for highly inflective languages. IEEE International Conference on Acoustics, Speech and Signal Processing, Taipei, 2009, pp. 4725-4728.
Mikolov, T., Chen, K., Corrado, G., Dean, J. (2013), Efficient Estimation of Word Representations in Vector Space. Arxiv.
RAND Corporation (2016), Autonomous Vehicle Technology. A Guide for Policymakers, https://www.rand.org/pubs/research_reports/RR443-2.html.
Mapping the tech world using text mining methods
Executive summary
This study presents an innovative methodology for analysing technology news using various text mining methods. News articles provide a rich source of information to track promising emerging technologies, relevant social challenges or policy issues. Our goal is to support the Next Generation Internet initiative by providing data science tools to map and analyse the developments of the tech word. Based on more than 200 000 articles from major media outlets, we are going to:
To meet these goals, a number of machine learning techniques are combined. The major steps can be summarised as follows:
The topics selected for the deep dives are:
The Policy topic groups together 3 areas: Social media crisis, Privacy and 5G.
Wide areas selected for deep-dive analyses

The 17 umbrella topics are identified using the topic modelling technique Latent Dirichlet Allocation. Besides the topics selected for deep dives, such areas are highlighted as Smartphones, CPU and other hardware, Digital ecosystems or Space.
Next, various maps are created based on the t-SNE algorithm. The example below presents the news stories in two-dimensions: articles that report on the same subject are clustered together. We demonstrate that this technique is highly useful to discover more narrow, domain-specific areas within the umbrella topics. Moreover, the distance between clusters is also meaningful, enabling the analysis of relationships between topics as well.
As an example, within the AI and robots topic, the map reveals groups of articles focused on such issues as:
It is also visible that articles on social and ethical issues are closer to each other, while articles on AI in self-driving cars are placed near business news on ride-sharing apps. It shows that our methodology is efficient in decreasing the complexity of text data, enabling to analyse and map topics.
All maps are interactive, inviting users to explore the headline of articles. Click here for an interactive version.
Example articles
Social and economic aspects of robotics
Ethical aspects of AI
Self-driving cars technologies
The presented methodology provides intuitive, easily understandable results. To enhance the exploration of results, the study is presented as an interactive guide. This report has been designed with different readers in mind, offering various journeys. To analyse and understand the results, it is sufficient to read the introduction and results sections. We also prepared a guide briefly explaining various text-mining methods for anyone interested. Finally, detailed description of methods are included for proper reproducibility of the study in the methods section.
Introduction
News media provides wide coverage of breakthroughs and challenges related to technologies. This means that the information on technological developments throughout the years is freely available online. We created a set of innovative tools and measures to compile the information scattered online and to discover the patterns hidden beneath.
The data set consists of 213 000 tech media articles published by 14 major English-language online publishers (e.g. the Guardian, the Verge and Ars Technica). The data has been collected for a period of 40 months (between 2016-01-01 and 2019-04-30), and contains article metadata (name of the author, publication date etc.) and plain text. The data sets prepared during the project are available with documentation in a Zenodo repository.
In our previous works, we focused on dynamic changes to explore trends (see: Gyódi, Nawaro, Paliński and Wilamowski, 2019). Based on the evolution of term frequencies over time, we offered an overview of the most trending technologies and social issues. To further examine trending topics, we implemented various methods, including co-occurrence and sentiment analyses. These methods are useful in analysing the most important tech stories, providing informative, easy-to-interpret results. On the other hand, the pipeline of the analysis required a close evaluation and manual filtering of results.
In this study, we take a different approach: instead of examining time dynamics, we focus on the mapping of topics discussed in technology news. Finding themes in a large number of news stories is challenging, as they remain latent or hidden. Moreover, a given news is usually related to various general topics at the same time, e.g. a story discussing the Cambridge Analytica scandal can be classified both to social media, policy and business categories.
We have two main goals:
First, we implement topic modelling analysis to group articles into wide categories. Second, the t-SNE algorithm is used to map articles in a two-dimensional space, clustering articles on the same subject together. The combination of these methods not only helps us to evaluate the main areas of tech news (such as policy issues, AI or social media), but also to dive deeper by preparing separate maps of narrow fields.
We create an automated data pipeline with a reduced role of intermediate qualitative analysis. This means that while the implemented methods are complex and belong to the state-of-the-art of text mining, the new tools remain easy to use. As before, the results are presented in the form of interactive visualisations.
Our study begins with an introduction of the applied text mining methods. Next, results are presented in two parts: first, the broad topics discussed in tech news are described, followed by the qualitative analysis of five key NGI areas.
Our aim was to present the results in the most convenient form for different stakeholders. Therefore, we have prepared sections that are especially dedicated to: policy makers and tech enthusiasts; non-technical readers interested in data analysis; and data scientists with background in text mining methods.
We offer the following independent reading paths through our deliverable:
Policy makers can jump right into results section where we present and interpret our findings. We hope that providing a distilled image of the current tech landscape will be helpful in agenda-setting for innovative policy.
For non-technical readers interested in machine learning, we have prepared a theoretical overview section. It covers brief introduction to dimensionality reduction and topic modelling techniques.
Savvy data science readers might skip theoretical overview and head directly to the methods section. In this chapter we describe in greater detail the techniques we have utilized and how we fine-tuned the algorithms.
Theoretical overview
This section provides an introduction into the text-mining methods used in the study. We concentrated on two main techniques: topic modelling with Latent Dirichlet Allocation, and t-SNE for document clustering. Moreover, we also experimented with the deep learning method word2vec. For a more technical description, see the Methods section.
Introduction to dimensionality reduction
In this analysis, we are dealing with more than 200 000 articles published online - from short news to more detailed long-reads. The raw text of these articles, containing tens of thousands of individual words, serves as input for text mining. Text mining methods rely heavily on linear algebra, therefore the input information needs to be transformed into matrix form. The text data is represented as a bag-of-words (BOW) matrix, where each row is a document and each column corresponds to a different word and contains the number of its occurrences in the documents.
Even this representation loses some information: neither grammar nor word order is preserved. Still, our data is high-dimensional, with hundreds of thousands of unique terms. So many dimensions make it impossible to analyse trends or find patterns in the data: we need to discover its hidden, lower-dimensional structure.
A common method for reducing dimensionality is Principal Components Analysis (PCA). Data is transformed into multiple – usually 2 for visualization purposes, possibly more if we expect more factors to determine the data – components which must be unrelated to each other. Each successive component explains less and less variance in the data. Therefore, by selecting the first few factors, a large share of variance can be explained.
Non-negative matrix factorization (NMF) is closely related to PCA. NMF decomposes the matrix into two matrices that contain no negative elements and are easier to interpret. Another method, singular value decomposition (SVD) decomposes the matrix into three matrices with constraints. The matrix in the middle plays key role, as numbers on its diagonal represent scaling in the particular dimensions. Truncated SVD keeps only the largest numbers, less important dimensions are discarded.
These methods, while useful for their simplicity and explicability, have some drawbacks. For visualizing text data, they usually result in a cloud of vaguely connected articles. Our aim is to find well separated topics that clearly differentiate articles. One possible solution is the topic modelling method Latent Dirichlet Allocation (LDA), which is related to matrix factorization. Another possibility is the implementation of algorithms based on neighbor graphs, such as t-SNE.
In document clustering, our goal will be to present the articles in a two-dimensional space. We will rely heavily on truncated SVD and PCA as the initial steps in the process. Truncated SVD is used to simplify computations while maintaining structure of the data. Next, PCA is implemented to transform the data into two-dimensions.
LDA
Topic modelling methods enable the thematic mapping of large amounts of text data. Topic modelling assumes that documents, such as news articles, contain various distinguishable topics. As an example, a news article covering the Cambridge Analytica scandal may contain the following topics: social media, politics and tech regulations, with the following proportions: 60% social media, 30% politics and 10% tech regulations. The other assumption is that topics contain characteristic vocabularies, e.g. the social media topic is described by the words Facebook, Twitter etc.
LDA is a popular topic modelling method due to its ease of use, flexibility and interpretable results. LDA has been proposed by Blei et al. (2003), based on Bayesian statistics. The method’s name provides its key foundations. Latent comes from the assumption that documents contain latent topics that we do not know a priori. Allocation shows that we allocate words to topics, and topics to documents. Dirichlet is a multinomial likelihood distribution: it provides the joint distribution of any number of outcomes. As an example, Dirichlet distribution can describe the occurrences of observed species in a safari (Downey, 2013). In LDA, it describes the distribution of topics in documents, and the distribution of words in topics.
The premise of the topic modelling methods is simple: we describe and recreate our texts with a combination of topics consisting of specific words. More precisely, we aim at recreating our BOW word-document matrix with the combination of two matrices: the matrix containing the Dirichlet distribution of topics in documents (topic-document matrix), and the matrix containing the words in topics (word-topic matrix). The construction of the final matrices is achieved by a process called Gibbs sampling. The idea behind Gibbs sampling is to introduce changes into the two matrices word-by-word: change the topic allocation of a selected word in a document, and evaluate if this change improves the decomposition of our document. Repeating the steps of the Gibbs sampling in all documents provides the final matrices that provide the best description of the sample.
In our analysis, LDA will be used in a two-stage process. First, the entire sample of news articles will be divided into wide categories, such as business, policy or AI. The category of the document will be allocated based on the dominant topic - the topic with the highest share in the document. In the second stage, LDA will be implemented again for articles in the individual categories, to explore latent topics within them.
t-SNE
t-SNE has been introduced by Van der Maaten and Hinton (2008) and followed multiple attempts to find a dimensionality reduction algorithm that preserves local structure. This means that observations that are close to each other in the input high-dimensional place are also placed close to each other in the output low-dimensional space, but separate to other articles, e.g. articles about bitcoin should form a separate cloud to articles about AI. In contrast to earlier algorithms designed with preserving local structure in mind, it managed to gain traction and has been cited in almost 10 thousand articles according to Google Scholar.
SNE, the base algorithm for t-SNE, minimizes the difference between probability distributions for full-dimensional and low-dimensional data representations. The goal is to preserve conditional probabilities that a point would choose another point as its neighbor. A crucial parameter of the algorithm is perplexity, which can be understood as the number of nearest neighbors considered.
The crowding problem is a challenge for such algorithms – as an example, in a 3-dimensional space, one can find 4 points which are equally distant from each other (corners of a tetrahedron), while in 2 dimensions, only 3 such points may exist (triangle). Preserving this similarity in transformation from 3 to 2 dimensions is mathematically impossible, but there are ways to minimise its effects.
Another important goal is to maintain the global structure of data: the distance between topic clouds should be meaningful, e.g. the cloud with articles on bitcoin should be close to the cloud collecting documents on ether, and further from articles on AI. Recent developments in biology – where t-SNE is widely used in transcriptomics – describe improvements in visualization regarding the global structure. The procedure offered by Kobak and Berens (2018) begins with PCA as the starting point, and continues with “perplexity annealing” – output from high-perplexity t-SNE is used as initialization for lower-perplexity t-SNE.
Our results show that using this combination of methods has various advantages. First, we reduce the number of dimensions of our text data to 2 with SVD and PCA. Next, we implement t-SNE with high perplexity, creating a two-dimensional map, where each document has a large number of neighbours. Finally, we repeat the t-SNE with low perplexity, reducing the number of neighbours. The results show that articles covering similar topics will be placed close to each other by the algorithm, maintaining the distance between distant topics.
Word vectorization
Documents can be represented as bag-of-words model described above. Even without any further transformations, we can compute similarities between documents by word co-occurrence, and through further transformations compute similarity (e.g. cosine metric) in latent dimensions. Similarly, computing similarities between words is possible, although word representations have to be constructed in a more complex way.
Word2vec is a powerful deep learning method that is widely used in next-word prediction, e.g. in predictive typing applications. Neural networks are used by Word2Vec to find the latent structure in words. Neural networks have an input layer, an output layer, and one or more hidden layers in between. They are loosely based on the design of the human brain. The basic machine learning architecture is neural network language model by Bengio, Ducharme, Vincent and Jarvin (2003). Previous algorithms have high computational complexity due to the non-linear hidden layer, while Word2Vec reduces this complexity by removing the non-linear hidden layer – maintaining only the linear layer – and sharing the projection (discrete-continuous transformation) layer for all words.
The basic choice in model architecture is between continuous bag-of-words (CBOW) and skip-gram. CBOW uses multiple neighbouring words as input to predict one word, while skip-gram uses one word as input to predict multiple neighbouring words (Mikolov et al., 2013). The predictions are only artificial and in fact are not used anymore. Weights of the hidden layer are used as word representations. This trick allows us to get some kind of latent dimensions in an unsupervised way – the user does not have to define what they expect.
When words are represented as n-dimensional vectors, they can be added together. With Word2vec, we can analyse word pair relationships, such as similarity (e.g. synonyms) or analogies (e.g. “king”-“man”+“woman”=“queen”). Dimensions are not easily interpretable, but word-pair relationships can be derived from vector arithmetic. Mikolov et al. (2013) conclude that subtracting two word vectors and then adding the result to another vector can find word pair relationships with high accuracy. For example, Paris - France + Italy = Rome, if Japan is added instead of Italy, the result is Tokyo. Changing Italy to Florida makes the mathematical operation return Tallahassee (the capital of the state).
Multiple word2vec models have been trained on various data sets, such as Google News and Wikipedia. Using domain-specific data sets, we can obtain more precise representations. Synonyms are one of the most difficult problems in word representations – if one word is represented by one vector, can this vector represent multiple meanings? For example, Amazon can be a company, a river or a rainforest. Similarity between Amazon (company) and Microsoft would be high, but between Amazon (river) and Microsoft rather low. In the case of pre-trained representations, if Wikipedia has been the source, it may show a bias towards geographical terms – which is undesirable in our case. The tech news data set that we used should mitigate this issue, but it was uncertain how it will work compared with other data sets. The Google News data set has almost 3 million words and phrases without lemmatization, while lemmatized corpora contain about 300 thousand words. Comparatively, our data set is small. Fortunately, it has delivered sufficient performance for our use case.
The usage of word2vec will be experimental in our study. We will demonstrate its potential on various examples of word relations, including word similarities, analogies and word pairs. As the results are more technical, we present them in Methodology section.
Methods: technical description
This section presents the more technical description of the used methods. Readers less interested in the text mining process may skip directly to the Results section.
Here we also introduce the results of experimentations that are less relevant for the qualitative analysis of our results.
LSA
Our first approach was pure Latent Semantic Analysis (LSA) based on truncated SVD. After creation of a bag-of-words matrix transformed by term frequency- inverse document frequency (tf-idf), we computed how 100-dimensional SVD behaves after 10 iterations (default solver is randomized). We have realized that for simple topics, it has significant value – most similar articles measured by cosine similarity to an article about AI in self-driving did result in mostly correct solutions. However, it could only be used as a starting position for further computations – there are too many dimensions to visualize. It also lacks interpretability for the typical dimension numbers. Nevertheless, it provides a reasonable base for further algorithms.
LDA
For easier interpretation of results, we implemented Latent Dirichlet Allocation. First, stopwords were removed from the corpus. As in LSA, the bag-of-word matrix was transformed with tf-idf. Gensim, which has been created by leading natural language processing researchers, has been the chosen library due to its effectiveness in multicore computations and wide array of settings. Three key parameters were controlled by us:
The parameters were adjusted depending on the size of the corpus. A wide array of topic numbers were tested (from 10 to 150), and we found that topic numbers between 20 and 30 resulted in good topic separation. In the case of the prior distributions, the default setting is equal to symmetric 1/number_of_topics in the case of alpha and eta. Besides the default settings, we experimented with the “auto” setting (Gensim learns asymmetric priors from the corpus), and with decreasing the value of the symmetric priors. In general, lower alpha and eta values lead to fewer topics in documents, and less words per topic that can be often beneficial. Asymmetric priors were dismissed due to the tendency to select few topics with very large shares in documents. We experimented with various applications of LDA in our analysis that are presented below.
One stage LDA with time dimension
Initially, our idea was to examine how various topics evolved over time based on their shares in documents. We performed LDA over the entire corpus and grouped articles into topics based on the dominant topic or minimum topic share (e.g. if topic 1 had at least 10% share in a document, the document was assigned to topic 1 - articles could belong to multiple topics). Next, we calculated the monthly share of articles that belonged to a specific topics, and visualised the changes over time.
On the one hand, the method worked well in the case of certain stable topics. As an example, the changing share of articles covering Apple products reflected the company’s release cycle, with peaks in every September. However, in the case of most topics, the dynamic fluctuation lacked pattern and seemed to be random (e.g. cloud topic). For this reason, we did not pursue this idea further.
Two stage LDA
Our effort to discover narrow, specific topics was not successful with a large number of topics (50-100). While a few topics were well separated, the vast majority of topics were charaterised by mixed keywords, making further analysis difficult. However, decreasing the number of topics resulted in a clearly defined, but broad topics. Therefore, we opted for a two-stage process.
During the first stage of topic modelling we have implemented LDA on the whole text corpus. Our aim during this stage was to obtain a satisfactory level of topic separation, i.e. a situation in which topics are neither all issues lumped together nor overly fragmented ones. In order to achieve that we have experimented with different LDA hyper parameters levels. For settings with 20 topics and default priors, the topics were balanced and separable. We managed to reach gradually decreasing topic sizes: the largest topic has a share of 19%, the 5th 8%, and the 10th 5%. In the case of higher topic numbers, the distribution of topics was much more skewed towards few dominant topics.
From the topic keywords, we were able to easily determine the described domain areas, such as AI, cybersecurity or policy issues. Based on the dominant topic, we were able to group articles into five well-defined, broad categories: AI, Policy, Social media, Business and Cybersecurity.
To pursue the analysis further, our aim was to discover the more narrow, specific topics within the defined groups – e.g. topics within the AI group only. We performed a second stage LDA: topic modelling on each group individually. Based on our experimentation, returning to the original bag of words matrix provides more separated topics. Therefore, we selected the rows with the relevant articles and performed the tf-idf transformation separately for each group. Depending on the groups of articles, different LDA parameters were used:
The results of the second stage LDA were promising for some of the wide areas: e.g. for articles belonging to Policy, the algorithm showed keywords related to such areas as 5G, the FCC or EU regulations of big tech. However, for articles on cybersecurity or social media, the second stage topics did not bring new information. For the qualitative analysis of results, see the Results section.
For visualising the results, the pyLDAvis package was used. The positions of circles were determined by computing the distance between the topics with the help of multidimensional scaling technique (MDS), and then the inter-topic distances were projected onto two dimensions (see: Chuang et al., 2012).
t-SNE
LDA’s shortcoming is the need to choose the number of topics in advance. It does not have sufficiently good performance for a large number of topics at once, which is why we experimented with two stages of LDA. Moreover, the need to assign each document to a topic reduces robustness.
In search for the solution for the above mentioned problems we turned towards experiments with more advanced dimensionality reduction techniques. First we tried UMAP (Uniform Manifold Approximation and Projection, which is a novel, topology-based method. We did not choose UMAP as the basic method due to the results of an initial series of trials. The experimentation revealed the ineffectiveness of UMAP in separating more difficult topics, placing most articles in the middle of the two-dimensional charts. The local forces are most likely not strong enough to outweigh global ones and it fails to discover the structure, in spite of the structure existing as proven by t-Stochastic Neighbor Embedding (t-SNE).
On the other hand, our experiments with t-SNE showed that it is more suitable to our needs and is able to identify clusters of articles on specific topics. We have chosen openTSNE library, which is advertised as “extensible and parallel”. Thanks to speed and scaling improvements over common t-SNE implementations such as scikit-learn’s manifold.TSNE, we have been able to do computations fairly quickly (less than an hour for a data set with about 50 thousand observations), even though we still have been memory-limited – particularly due to truncated SVD computations, which failed on the full data set. The results we present are based on the following steps:
6.1. 250 iterations, exaggeration 12, momentum 0.5
6.2. 750 iterations, momentum 0.8
Comparing these results to t-SNE with default optimizations, which also uses two separate embedding optimizations (250 and 750 iterations), we do not see a large difference. Probably the reason is PCA initialization. Nevertheless, maintaining more global structure is a preferable outcome, so the perplexity annealing method is used as default.
The maps prepared with t-SNE present article clusters with desirable features (available in Results section. Separate, but related topics appear close to each other, as in the case of articles on Tesla and Uber on the Policy map (two companies in the transportation industry).
All computations had been conducted on the entire data set of articles in a given group. However, for performance issues and readability, the visualisations present only a randomly chosen subset of articles.
Word2vec
LDA and t-SNE enable us to discover latent topics in our articles and to explore relations between various clusters of articles. Word2vec might give us an opportunity to analyze our text corpus on a much finer level of granularity. Thanks to pseudo-algebraic operations between words made possible by word2vec we can e.g. experiment with discovering common relationships between certain pairs of concepts, i.e. move from topic modelling to semantic analysis. Please note that this deliverable covers only initial results of the analysis, we plan to experiment with vectorization methods in further work.
We used CBOW (continuous bag-of-words) as the base model – skip-gram achieves consistently worse results by expert analysis on examples we checked. We suppose the cause is the relatively small size of the data set – skip-gram is more complex and uncertain, and although large quantities of data in massive data sets alleviate these problems and allow using this architecture, with smaller data sets we are better off using CBOW.
Testing the model trained on Google News data set (Mikolov et al., 2013), some pairs miss the point: Microsoft-Ballmer relationship for Google returns Yahoo, and for IBM – McNealy (founder of Sun Microsystems). In the model trained on our dataset, vector arithmetic with Google returns Sergey Brin as the first result, with Singhal and Giannandrea being the next closest matches (former and current heads of Search team). The result for IBM is still incorrect – Gordon is the closest match (Ginni Rometty is the current CEO of IBM, Gordon Fuller is the Chief Learning Officer in the company). The model based on Google news also makes a mistake with company-desktop operating system relationship for Apple; our model returns Mac, which is also not the ideal solution (MacOS would be, and the word indeed exists in the dictionary – with the reverse arithmetic, macos - apple + microsoft = windows).
Arithmetic on basic concepts, like brother - man + woman does not return the expected result (sister), even though all proposed terms – daughter, girlfriend, wife, husband – are related kinship/relationship concepts. Domain-specific similarities are well-preserved, for example uber - ridesharing + dating = tinder, as well as some generic terms: washington - united_states + european_union = brussels.
Top 10 most similar words to Trump by CBOW model includes Obama, Vladimir Putin and Clinton, while only 1 word in skip-gram is a different person than Donald Trump – skip-gram includes terms like campaign trail, nominee Donald or Republican nominee. It finds synonyms better, but that was not our goal – finding related terms is preferable.
Vectorization of particular relationships is shown in the figures below. The 100-dimensional vector has been transformed by PCA to 2 dimensions for each group separately. Arrows represent the expected relationship between terms. Arrows are meant to be roughly similar for all connected relationships.
Results: qualitative analysis
We summarise the main results in the next sections, focusing on policy-relevant findings. First, we identify key areas discussed in tech news using topic modelling. Next, we examine the relationships between topics by mapping article clusters. In the following parts, we dive deeper into five key NGI areas, providing more detailed insights.
Broad topic identification
We begin our analysis with topic modelling conducted on all articles in our data set. The visualisation below presents 20 identified topics: each circle represents a topic, with decreasing order relative to size (Topic 1 is the most prevalent in the documents). The distance between topics is determined by the similarity of vocabularies: topics sharing the same words are closer to each other. In the right panel, the bars represent the unique terms that are characteristic for the selected topic. A pair of overlapping bars represent both the corpus-wide and topic-specific frequency of a given term.
We labeled each topic based on the top-30 most relevant terms. Upon closer examination, we have reduced the number of topics to 17 (topics 5 & 16 became the joint category Space tech, topics 10 & 19 were melded together to form a topic on Media and 14 & 15 became a joint Hardware category). In the following sections we provide brief descriptions of the identified topics.
Topic 1: AI & robots constitutes the largest topic containing around 19% of all words and is characterized by machine learning jargon (e.g. train data), as well as popular ML applications (robots, autonomous cars).
Topic 2: Social media is similarly prevalent and covers the contentious aspects of modern social media platforms (facebook, twitter), such as right to privacy, content moderation, user bans or election meddling with the use of microtargeting (i.a.: privacy, ban, election, content, remove).
Topic 3: A large share of tech articles covers business news, especially on major platforms (uber, amazon), services such as cloud computing (aws) or emerging technologies as IoT or blockchain. The topic words also suggest great focus on the financial results of tech companies (revenue, billion, sale, growth).
Topic 4: Two major manufacturers - Samsung and Apple are on the top of the keyword list with equal number of appearances. Articles are focused on the features, parameters and additional services provided by devices (camera, display, alexa etc.).
Topic 5 & Topic 16: Space exploration excitement is common in the tech press. The joint Space topic contains reports about NASA, future Mars and Moon missions, as well as companies working on space technologies (e.g. SpaceX).
Topic 6: this topic revolves around the Cambridge Analytica privacy scandal and gathers all mentions of this keyword in the corpus. The involvement of Cambridge Analytica in the Leave campaign during the Brexit referendum is of major focus, as suggested by the high position of keywords such as EU and UK. Unsurprisingly, GDPR is also often mentioned in the articles dealing with the aftermath of the CA controversy.
Topic 7: The Cybersecurity area explores cyberspace security issues related to both widely-used computer systems, as well as novel decentralized technologies, e.g. based on blockchain.
Topic 8: The much anticipated fifth-generation wireless network has huge potential to transform all areas dependent on ICT. The 5G topic deals with global competition over delivering 5G tech to the market (huawei, ericsson). It captures also the debate about 5G’s impact on net neutrality. 5G’s main quality is to enable signal ‘segmentation’, causing debate whether it can be treated like previous generations of mobile communications by net neutrality laws.
Topic 9: The focus of the area is on operating systems, both mobile (ios, android), desktop, (windows, macos) as well as dedicated services (browsers chrome, mozilla) and app stores (appstore).
Topics 10. & 19: The joint media topic revolves around the most important media platforms: streaming and social media. The global video streaming market size was valued at around 37 billion dollars in 2018, while the worth of music streaming is estimated at 9B, accounting for nearly half of the music industry’s revenue (Grand View Research 2019). Particularly, this topic focuses on major streaming platforms (youtube, netflix, spotify), social media (facebook, instagram, snapchat), the rising popularity of podcasts and business strategies of streaming services (subscriptions, ads).
Topic 11: During its 40 year history, Microsoft has made above 200 acquisitions. Some of them were considered to be successful (e.g. LinkedIn, Skype), while others were less so… (Nokia). Topic 11 collects articles describing Microsoft finished, planned and failed acquisitions in the recent years (github, skype, dropbox, slack).
Topic 12: Autonomous transportation is a vital point of public debate. Policy makers should consider whether to apply subsidies or taxes to equalize the public and private costs and benefits of this technology. AV technology offers the possibility of significant benefits to social welfare — saving lives; reducing crashes, congestion, fuel consumption, and pollution; increasing mobility for the disabled; and ultimately improving land use (RAND, 2016). Topic 12 addresses technological shortcomings of the technology (batteries) as well as positive externalities such as lower emissions (epa, emissions).
Topic 13: the topic modelling analysis identified Tesla and other Elon Musk projects as a separate topic. Besides Tesla developments of electric and autonomous vehicles, the topic also includes words related to other electric mobility solutions (e.g. Lime).
Topics 14. & 15: Topic 14 covers the CPU innovation race between Intel and AMD, as well as the Broadcom-Qualcomm acquisition story (the acquisition was blocked by Donald Trump due to national security concerns). Topic 15 includes news regarding various standards (usb-c) and storage devices (ssd).
Topic 17: this area concentrates on startup ecosystems and crowdsource financing. Articles discuss major startup competitions such as Startup Battlefield or Startup Alley, and crowdfunding services such as Patreon.
Topic 18: We observe a surge in the adoption of wearables, such as fitness trackers, smart watches or augmented and virtual reality headsets. This trend brings important policy questions. On one hand, wearables offer tremendous potential when it comes to monitoring health. On the other hand, it might be overshadowed with concerns about user privacy and access to personal data. Articles in topic 18 discuss news from the wearable devices world regarding new devices, novel features etc. (fitbit, heartrate).
Topic 20: the final topic deals with the gaming industry. It covers inter alia popular games (pokemon), gaming platforms (nintendo), various game consoles (switch) and game expos (e3).
Mapping all articles
We were able to observe the most prevalent topics from the topic modelling analysis. However, it is difficult to unravel further details based on the analysis of topic-words. To examine which articles discuss the various topics, we turn to document clustering with t-SNE.
The map presents the articles in two dimensions: neighbouring articles are characterised by similar vocabulary and are likely to cover the same subject. Additionally, we also mark the results of the topic modelling analysis with colours: it marks the dominant topic of the document. For better visibility, the map presents different colours for the 8 most frequent topics, while the rest is merged into one category (‘Other’). The map also enables to view the article titles below the chart.
Open in new tabThe map shows that LDA and t-SNE similarly grouped our documents: articles with the same colour are placed close to each other by t-SNE. We can identify large groups of green, blue, purple etc. articles. This supports the robustness of the text mining strategy.
Moreover, the map proves the aptitude of our methods to provide clusters of articles with different levels of granularity. Based on the analysis of clusters, we are able to identify more specific areas inside the wide umbrella topics determined by LDA. As an example, LDA returned a broad category of articles dealing mostly with social media crisis issues. t-SNE helps us to further classify these articles into smaller clusters: focused on specific social media platforms (e.g. articles on Twitter can be found at (50,-10), on Facebook at (50,10), or on president Trump’s usage of social media (0,-30).
Another advantage of t-SNE is demonstrated by the cluster on the Apple-FBI Encryption Debate (35,10). Based on the LDA topic terms, we named the entire green topic as social media crisis, while this group of articles also includes other tech policy areas. t-SNE helps us in recognising these more nuanced details.
It is also worth noticing how t-SNE grouped together articles from various LDA topics that share a common feature. One such example is the cluster on Google (20, 10) that includes stories on the problems of Youtube, business news or articles on Google’s software development for smartphones.
Clouds proximity to each other also seems to be meaningful and informative as it can be observed by the example of the AI & robots cluster. In the upper left part of the figure (-35,30) a group of articles covering robotics can be found. The left part of the cloud consists of articles discussing mostly the transformative potential of robotic technologies (e.g. job automation), whereas the right part pertains to hardware issues (e.g. batteries). The whole robotics cluster is close to an another blue cluster related to conscious AI and real autonomous AI (-30,20). As we can see, distance in space resembles here the “thematic distance”.
Similar regularities can be observed in the remaining clusters regarding: business news, smartphones, cybersecurity, cross platform development, streaming and space exploration.
For example, in the case of cybersecurity articles there is a clear division between the cluster regarding security of decentralized networks (0,-55), and the cluster dealing with data breaches (15,-15). The latter one is positioned logically next to the cluster of articles concerning online privacy issues (10,-15).
In the smartphone subcategory, we can observe that articles related to various VR technologies (0,55) are close to the articles on smartphone camera technologies (0,40). Articles on new features and sales of successive iPhone generations are gathered at (35,20), just to the right of a cluster related to iOS.
Deep dives into key NGI areas
In the first stage of the analysis, we identified the broad topics recurring in the technology media discussions. Next, we analyse selected key areas at a more granular level. We focus on five areas that are especially important from the NGI perspective:
The Policy area groups together articles with different dominant topics: Social media crisis (Topic 2), Privacy (Topic 6) and 5G (Topic 8).
In the deep dives, we separately analyse the articles that belong to the 5 wide thematic groups. We repeat the steps from the previous mapping: first, we implement topic modelling, then cluster articles with t-SNE. Therefore, we should obtain more domain specific, narrow topics and article clusters. In our analysis, we will focus on the maps; for the detailed list of topic-words, please see the Annex.
AI & robots
Open in new tabFollowing the identification of articles with dominant AI topic, a second-stage LDA analysis is carried out to unravel narrower AI-specific subjects. The five most important topics are: AI companies (company, data, startup), robotics (robot, system), data (network, process), user centric (people, human) and science (star, scientist, blackhole). As the topic-words show, the discovered topics are still rather general. To better understand the content of news stories on AI, the articles are also clustered with T-sne.
The map confirms again that LDA and t-sne similarly groups the documents, as articles with the same color are placed close to each other.
Analysing the smaller clusters of articles within the various color groups, specific smaller topics can be found. Among the blue clusters, we can discover such topics as AI and health (-30, 10) or the ethical challenges of AI (0, 40). The health cluster includes the developments of various companies (e.g. advancements in Google’s AI in diagnostics), news on smart wearable devices, the pressure on public health care for digitalisation. The ethical AI cluster reports on calls for regulatory control over AI development and various industry initiatives (e.g. the adoption of principles for ethical AI by SAP or the OpenAI group).
Coming to clusters associated with the orange colour (robotics), the following sub-fields can be explored: robot developments (40, -20), drones (50, 0), car industry (25, 20) or VR applications (5, 50).
The exciting new technologies include among others soft robots, bipedal locomotion and biohybrid robots. In terms of human-AI interaction, the articles covered the recent successes of AI over human players in GO and Dota, the usage of AI and robots in sports and also developing the skills’s of AI by human games (e.g. pictionary).
The robotics group well demonstrates that articles with the same dominant topic can form clusters in distinct areas of the map. This shows why t-SNE is helpful: while it keeps articles with the same latent topic close to each other locally, it also maintains global differences. For example, VR (5, 50) is close to a cluster on games (15, 50), and the car industry (25, 20) is next to a cluster collecting articles on Tesla (20, 30). This solves the problem stemming from grouping articles based on dominant topics: as a document is a mixture of topics, there is a wide array of edge cases where the same article could land either in the robotics group, as well as in the group AI companies.
The green clusters are centered around various technologies: quantum computers (-50, -15), IoT (-15, 15) and cloud computing (-15, 20). Open source technologies (such as Kubernetes, Linux or OpenStack) are discussed in the cluster (-25,40).
It is also worth exploring two clusters on science: purple (-35, -40) discussing astronomy news and red covering genome research (-20, -40).
Policy
Open in new tabFor articles with dominant topics related to policy, the second stage LDA provides one big category (social media), and a number of small ones (tech investigations, 5G, investment funds and FCC).
First, let us focus on the large blue group of articles that focus on major platforms. Upon inspection of smaller clusters, the articles covering specific companies can be identified: YouTube (-10, 40), Twitter (-5, 50), Facebook (-30, 40), Tinder (0, 60), Google (10, 50), Amazon (40, 20), Airbnb (50, 20) and Uber (50, 10).
The titles of articles reporting on social media platforms show recurring challenges: fake accounts, the spread of extremist content, misinformation and election meddling. The map enables the exploration of individual stories, e.g. the Zuckerberg testimonies, the Cambridge Analytica scandal, or the spread of anti-vaccine conspiracy theories. In the case of Google, the articles reported on various biases (search results and ads), workplace sexual harassment scandals, and Google’s involvement in military AI projects.
The challenges are different for e-commerce giant Amazon: the articles focus on employment rights, data leaks, controversial tax arrangements and dangerous products.
Finally, the clusters on Airbnb and Uber contain articles on regulatory battles in cities and the gig workers’ rights.
In the case of the Uber cluster (50, 10), t-SNE grouped together articles from various colour groups, showing again the usefulness of the method. Therefore, all news stories on Uber can be evaluated together, even if LDA provided different topic shares. The cluster contains articles not only on worker rights, but also on passenger safety concerns, the Waymo lawsuit over IP theft, and various unethical conducts by the company (e.g. spying on rival Lyft’s drivers by hacking their IT system).
Coming to the tech investigations, distinctive groups are formed among others on tech patents, the Apple vs FBI battle, and on the legal issues around Microsoft.
Finally, two remaining LDA groups are well separated: 5G and FCC (Federal Communications Commission). In the context of 5G, especially important is the competition among the telecommunication companies, as well as national security (e.g. the debate on China’s Huawei). Articles on FCC mostly focus on net neutrality.
Media
Open in new tabThe LDA analysis grouped articles into the following main clusters: blue- Facebook (facebook, instagram, ad), orange - Apple services (service, video, music), green- ads (tv, facebook), red - Twitter (twitter, launch) and purple - streaming services (service, feature, launch).
Based on the keywords, it is rather difficult to capture the differences between groups, however, the t-SNE clustering helps us to better understand the underlying topics. Most importantly, t-SNE grouped together articles on the same platform and services: Pinterest (-10, 50), Instagram (30, 0), Facebook (various clusters in the blue group), Twitter (30, 40), Spotify (-30, -40), Apple Music (-40, -20), Tidal (-20, -40), Apple TV (-55, -10), Hulu (-40, 0), Netflix (-30, 10).
Moreover, competing platforms are in close proximity to each other: we can differentiate articles on music streaming in the lower left corner, and video streaming in the right (with news on Netflix, Disney, Youtube TV, Fox, Comcast, Apple TV). Also, a cluster on podcasts can be identified close to articles covering the two main players: Apple and Spotify.
It is worth noticing that while the previous policy section was dominated by articles covering the problems of social media, the articles of this section has a much greater emphasis on general business news. This shows that LDA can be useful to create wide groups of documents for further analysis.
Business
Open in new tabThe largest category identified in the second-stage LDA collected articles regarding investments in the tech industry. In this cluster you can find news about investments and acquisitions in specific sectors, e.g. short-term rentals (Airbnb and Guestly) (40,30), ride sharing platforms (Lyft, Uber) (0,60) or e-scooters (Lime, Spin) (-10,70).
The second most prevalent category collects articles about the business aspects of cloud computing. The cloud computing cluster provides insights into the cloud computing arms race and investments of cloud providers, e.g. AWS (20,-40), Oracle (5,-70) or Telstra (30,-50).
It also includes stories about new functionalities of different cloud providers, targeting mostly the needs of business clients, e.g. Google’s Dedicated Interconnect service (25,-30).
Although smaller, remaining clusters also exhibit good separation. Within the smartphone industry cluster, we find subclusters pertaining to specific manufacturers’ investments, e.g. Samsung (-35,30) or Apple (-45,10), as well as histories of long legal battles like the one between Apple and Qualcomm (-80,0). Articles in this subcluster discuss a battle over patent licensing between Apple and Qualcomm, and raise an important policy question: how a fair division of profits should look like in the smartphone industry.
The orange cluster contains stories of competition and business strategies in different digital industries. As an example, the articles around (-25,30) concern the financial situation of the audio streaming industry. The cluster also covers articles about the expansion of Chinese giants, e.g. Alibaba (20,30) or Tencent (-20,30).
Cybersecurity
Open in new tabTopic modelling helped us to identify five categories among articles focused on cybersecurity. Two major ones pertain to malware and decentralized world of cryptocurrencies and blockchain. The three others cover infamous data breaches, system vulnerabilities and the Australian cybersecurity strategy.
The malware category is further mapped with the help of t-SNE into subclusters concerning ransomware targeting different operating systems, apps, devices etc. Examples include Android vulnerabilities (like banking trojan Triada) (5,50), Wordpress targeted malware (25,40) or autonomous vehicles security, e.g. articles covering American lawmakers efforts to address vehicle hacking (50,20).
Other subclusters contain articles on different strategies used by attackers, e.g. encrypting the files of infected users for backmailing (e.g. Locky) (-55,20). On the side of defenders, we can find e.g. cluster on bug bounty initiatives and articles about ethical aspects of hacking, e.g. FitBit rewarding external vulnerability reports concerning its devices (45,20).
The second major t-SNE subcluster concerns in a large part the security of the crypto world: reports on stolen cryptocurrencies, as well as stories about illegal activity funded with bitcoin (e.g. election interference, ransom) (20,-40). The security of blockchain-based services in the financial, medical and voting systems subfields is covered in (5,-60).
The next cluster maps stories of massive data breaches, e.g. articles discussing causes and the aftermath of Yahoo data breach, affecting 32M accounts (55,-20) or traditional banking cybersecurity, e.g. disconcerting accidents of hacks on SWIFT network (-20,-60).
Besides data breaches motivated by financial gains, we can find subclusters populated with articles covering data leaks by whistleblowers, e.g. WikiLeaks revealing hacking and mass surveillance methods used by US government agencies (-30,50). The nearby cluster gathers information on Julian Assange’s Ecuador saga (-5,-35).
Two other, smaller clusters concern specific system vulnerabilities (-25,60) and Australian government’s efforts to position itself as a world leader in cyber threat detection, prevention and response, e.g. (-20,20).
Conclusions
This study presented a methodology for mapping the topics discussed in technology news. We discovered key areas of emerging technologies and social issues, and mapped the relationships between them.
First, we provided a bird’s eye view on the technology world with topic modelling. Topic modelling serves as an appropriate basis for exploring broad topics (e.g. social media crisis, AI or business news) and grouping articles for further analysis. At this stage, we were able to identify major umbrella topics that ignite the public debate.
Second, we investigated the subtopics within key areas crucial for the Next Generation Internet initiative: AI, Policy, Business, Cybersecurity and Media. In order to explore more nuanced areas within the broad topics, we not only implemented topic modelling, but also clustered articles using t-SNE. Using this joint technique, we prepared a series of maps presenting articles from chosen categories.
This approach proved to be successful regarding the identification of smaller article clusters, and provided more details than the sole implementation of topic modelling. Our results show that this combination of methods is well suited for mapping the tech news landscape.
We also experimented with the deep-learning method Word2vec for the analysis of particular semantic relationships in tech news. The Word2vec algorithm trained on our corpus brings promising results in comparison to the baseline solution, i.e. algorithm trained on the Google News data set.
The presented methods can be easily implemented for further investigation in the future. The study can be replicated for other technological areas or completely different text data as well.
About
NGI Forward has received funding from the European Union’s Horizon 2020 research and innovation programme under the Grant Agreement no 825652. The content of this website does not represent the opinion of the European Union, and the European Union is not responsible for any use that might be made of such content.
Annex
Table 1. AI topic keywords
Table 2. Business news topic keywords
Table 3. Cybersecurity topic keywords
Table 4. Media topic keywords
Table 5. Policy topic keywords
References
Bengio, Y., Ducharme, R., Vincent, P., Janvin, C. (2003), A neural probabilistic language model. Journal of Machine Learning Research 3: 1137–1155.
Blei, D., M., Edu, B., B., Ng, A. Y., Edu, A., S., Jordan, M., I., Edu, J., B. (2003), Latent
Dirichlet Allocation. Journal of Machine Learning Research 3.
Chuang, J., Manning, C., D., Heer, J. (2012), Termite: Visualization Techniques for Assessing Textual Topic Models. AVI ‘12, Capri Island.
Downey, A., B., (2013), “Think Bayes”, O’Reilly Media Inc, USA.
Gaussier, E., Goutte, C. (2005), Relation between PLSA and NMF and implications. Proceedings of the 28th annual international ACM SIGIR conference on Research and development in information retrieval. ACM.
Grand View Research, (2019), Video Streaming Market Size, Share & Trends Analysis Report By Streaming Scope, By Solution Scope, By Platform Scope, By Revenue Model, By Service, By Deployment, By User, And Segment Forecasts, 2019 - 2025.
Gyódi, K., Nawaro, Ł., Paliński, M., Wilamowski, M. (2019), Informing Policy with Text Mining: Technological Change and Social Challenges. Available at SSRN: https://ssrn.com/abstract=3362487 or http://dx.doi.org/10.2139/ssrn.3362487
Hotelling, H. (1933), Analysis of a complex of statistical variables into principal components. Journal of Educational Psychology, 24(6), 417-441.
Jolliffe, I. (2011), “Principal component analysis”. Springer Berlin, Heidelberg.
Kobak, D., Berens, P. (2018), The art of using t-SNE for single-cell transcriptomics. BioRxiv.
Maaten, L., Hinton, G. (2008), Visualizing data using t-SNE. Journal of Machine Learning Research 9.Nov, 2579-2605.
Mikolov, T., Kopecky, J., Burget, L., Glembek, O., Cernocky, J. (2009), Neural network based language models for highly inflective languages. IEEE International Conference on Acoustics, Speech and Signal Processing, Taipei, 2009, pp. 4725-4728.
Mikolov, T., Chen, K., Corrado, G., Dean, J. (2013), Efficient Estimation of Word Representations in Vector Space. Arxiv.
RAND Corporation (2016), Autonomous Vehicle Technology. A Guide for Policymakers, https://www.rand.org/pubs/research_reports/RR443-2.html.
tags:
topic modellingldat-SNE